

Background
HIVQUAL-Namibia was piloted in 2007 at 16 clinics with the Ministry of Health and Social Services (MoHSS) and technical support from CDC Namibia and HQI.
Data collection and QI project implementation has expanded to 38 HIV care and treatment facilities in all 34 health districts.
HQ-N has conducted submission of 10 consecutive rounds of performance measurement data from health care facilities between July 2007 and March 2013 representing over 37,000 individual patient charts sampled across review periods.
Demographic Data
- Population: 2 million
- HIV prevalence:
- 15.3% general adult population
- 17.8% among pregnant women 15-49 years
- TB/HIV prevalence: ~ 60% of TB patients have HIV
- Other pertinent Demographics: Namibia is a vast, sparsely populated country (one of the least dense in the world)
- Year Program Began: 2007 with 16 pilot sites
- Scope: Adult HIV with plans for expansion into pediatrics and PMTCT
- Number of facilities: 36
HIV/AIDS Epidemic:
With a population of approximately 2 million and life expectancy of 52 years, Namibia currently faces one of the world’s most profound dual epidemics of HIV and TB. The primary mode of transmission in this generalized HIV epidemic is heterosexual contact. Namibia is home to an estimated 200,000 adults and children living with HIV/AIDS, half of whom are women >15 years of age. In 2008, HIV prevalence was 15.3%. According to the UNAIDS Spectrum Model, prevalence is projected to increase slightly, to 15.9%, by 2012. The most recent antenatal clinic (ANC) HIV surveillance survey found that 19.9% of pregnant women were HIV positive. HIV prevalence continues to increase in specific regions and among certain age groups. For instance, there is a great disparity between the ANC HIV prevalence reported in Katima Mulilo (39.4%) and that reported in Opuwo and Gobabis (7.9%).[i]
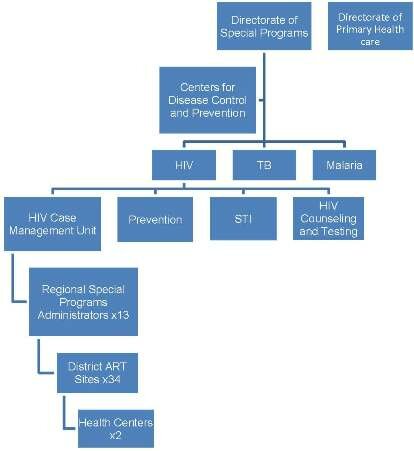
Namibia Health System Infrastructure:
Distinguished by a decentralized model of health care delivery, the MoHSS in Namibia is organized into four levels, including the national sector, 4 regional directorates corresponding to specific geographic areas, and 13 administrative regions subdivided into 34 health districts. The MoHSS provides technical support to regional management teams, human resource development, and regulatory oversight of clinical and administrative services. Four State Referral Hospitals are distributed throughout the country. In 1999, the National AIDS Coordination Program (NACOP) was established to oversee the different sectors responding to HIV. In 2002, the Directorate of Special Programs (DSP) was established within NACOP. Currently, access to ART and mainstreaming of HIV programs is occurring in all sectors with coordination of government offices, ministries/agencies, regions, NGOs, and FBOs through MoHSS. The private sector and various development partners also play a distinct role addressing the causes and reducing the burden of HIV/AIDS.
ART was rapidly rolled out to all 34 state hospitals in 2003. By 2006, Namibia had reached its WHO 3x5 targets, and by 2009, more than 70,000 adults and children were treated, with 135,000 patients enrolled in HIV care in the public sector.
As HQ-N expands, ongoing professional development for leadership and staff will be needed. The HQ-N team has successfully presented their work at international quality meetings, PEPFAR Implementers’ Meeting, ICASA and the World Union Conference. Application of knowledge gained at the European Forum on Quality & Safety in Healthcare has been rapid.
[i] UNAIDS/WHO/UNICEF Epidemiologic Fact Sheet, September 2008. Accessed on 01/11/10 at http://www.unaidsrstesa.org/countries/namibia


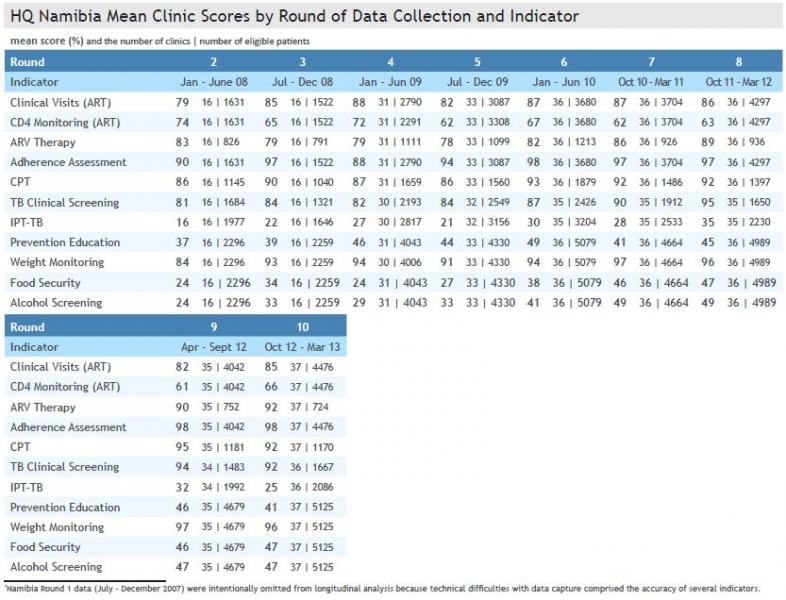
- HQ-Namibia clinics have collected 10 rounds of data reviewing care provided from July 2007 through March 2013
- Data from the 1st round of data collection were not included because technical difficulties with data capture on some indicators compromised the accuracy of the results
- 38 Namibia clinics have participated in HIVQUAL data collection
- 37,000 charts have been sampled for rounds 2-10
- Performance rates are shown for the following 12 indicators: clinical visits, CD4 monitoring, VL monitoring, ARV therapy, ART adherence assessment, CPT, TB clinical screen, IPT, prevention education, weight monitoring, food security and alcohol screening